Debugging Scripts in PowerShell: Breakpoints and SteppingDebugging Scripts in PowerShell: Breakpoints and Stepping
This guide walks developers through the process of using breakpoints and stepping to debug PowerShell scripts. We will focus on practical examples to illustrate each technique in action.
July 19, 2023

As a self-taught developer, I have relied on several simple but effective debugging tricks for decades. I’m talking about tricks like inserting a line of code designed to display variable contents or a message that confirms function calls. Although these tricks absolutely work, there are better debugging tools available, particularly within PowerShell ISE.
In this guide, I will introduce you to tools and techniques for debugging PowerShell scripts, starting with breakpoints. We will then examine the stepping method.
Working With Breakpoints in PowerShell
Breakpoints are incredibly useful for understanding what happens when a script is executed.
When you run a script, the code executes line by line, and various actions occur within the PowerShell session. These actions could involve declaring variables or establishing a remoting session. Normally, these activities are hidden from view, unless an error occurs or the script is designed to reveal what’s happening behind the scenes (e.g., by adding a line of code to display a variable’s contents solely for debugging purposes).
This is where breakpoints come in. A breakpoint is a designated point in the script where execution is paused.
The role of breakpoints
What makes breakpoints so interesting and helpful is that while the script execution is paused, your PowerShell session remains active. This means you can manually interact with PowerShell mid-script!
For instance, let’s say you have a complex PowerShell script that just isn’t working correctly. In such a case, you can set up a breakpoint at a strategic position within the script. When you execute the script, it will proceed normally until it reaches the breakpoint. When it does, you have the freedom to manually inspect the value of variables used in the script and interact with the session in any other useful manner.
How to use a line breakpoint
Now that I have explained the concept and functioning of breakpoints, let’s look at how to use them.
The first step is to enter your code into PowerShell ISE and save it. Once the code is saved, you can proceed to set a breakpoint. To set one, right-click on the desired line of code and select the “Toggle Breakpoint” command from the shortcut menu.
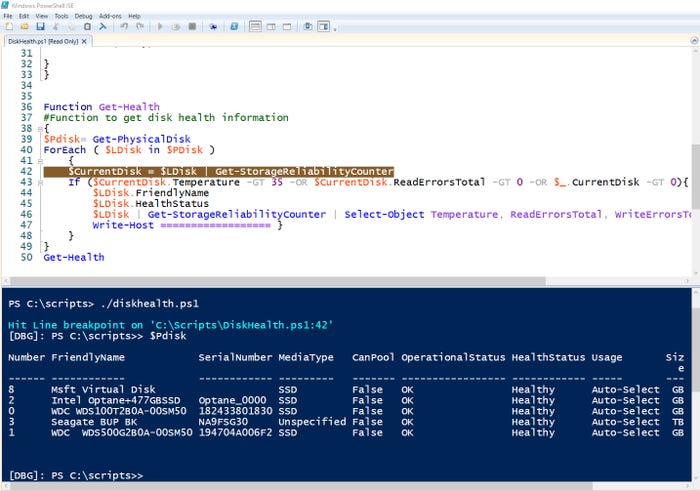
In Figure 1, you can see an example where I have inserted a breakpoint into my code. The line with the breakpoint line is highlighted in brown (Line 42 in the figure). The lower portion of the figure shows the code execution progress until it reaches the designated breakpoint. At that point, PowerShell says the script has encountered a breakpoint. The PowerShell prompt then changes to indicate that you are now in debugging mode.

PowerShell Debug 1-1
Figure 1. I have set a breakpoint on Line 42 of this script.
Now check out Figure 2. I have entered the name of one of the variables used in my script, and PowerShell has displayed its current value.

PowerShell Debug 1-2
Figure 2. The prompt has changed to indicate the debugging mode.
Once you have finished using the breakpoint, you can remove it by entering the following command:
Get-PSBreakpoint | Remove-PSBreakpointIt’s important to turn off debugging mode when you are done. Otherwise, you can’t make any edits to your script. To turn off debugging, simply click on the Debug menu and select the “Stop Debugger” command.
Variable and command breakpoints
The example I previously demonstrated is a line breakpoint. However, you can also create variable breakpoints and command breakpoints.
Variable breakpoints trigger whenever a specific variable’s value changes.
Command breakpoints trigger whenever a specific command is about to be executed.
You can’t set variable or command breakpoints using the line breakpoint method that I demonstrated. Instead, you must set them from the command line using the Set-PSBreakpoint command. Simply enter the Set-PSBreakpoint cmdlet, followed by either the Command or the Variable parameter, along with the specific command or variable you want to associate with the breakpoint.
Breakpoint ID numbers
Now let’s discuss the another important aspect of breakpoints. You can create multiple breakpoints for a single script. When doing so, each breakpoint is assigned a unique ID number. You can see the existing breakpoints along with their IDs by typing Get-PSBreakpoint.
If you need to delete a breakpoint, you can use the Remove-Breakpoint cmdlet followed by the breakpoint’s ID number. For example, to delete breakpoint 3, you would enter:
Remove-Breakpoint -ID 3Stepping Through a PowerShell Script
Now that we understand how to use breakpoints in PowerShell, I will introduce another useful debugging technique called “stepping.”
As noted above, line breakpoints allow you to pause the script execution at a specific line so that you can examine variable values. Stepping works similarly, but instead of pausing the code at a particular line, it pauses the code at every line of the script. That way, you can trace the script’s flow and inspect variable contents at any point in the execution process.
Stepping tasks
Before we look at how to step through a script, it’s important to note that there are four distinct tasks related to stepping.
Continue: The first task is simply called “Continue.” It lets you tell PowerShell that you want to stop stepping through the script. When you continue the script, PowerShell will execute the script until completion or until it encounters a breakpoint. To invoke the Continue task, you can press F5 or, as an alternative, press C followed by Enter in the console pane.
Step Into: The second task is called “Step Into.” When you choose to step into a script, PowerShell executes the current line of code and then stops at the next line. If the next line happens to be a function call, PowerShell will proceed to call the function and stop at its first line. You can engage the Step Into task by pressing F11. Alternatively, you can type S and press Enter in the PowerShell console.
Step Over: The third task to know is called “Step Over.” Like the Step Into task, Step Over executes the current line of code and then stops at the next line. However, the key difference is that if the next line happens to call a function, Step Over will execute the entire function without stepping through it line by line. You can invoke the Step Over task by pressing F10 or typing V + Enter in the PowerShell console.
Step Out: The fourth task is called Step Out. Stepping Out causes the current function to be stepped. If the function is nested, one additional level will also be stepped. To invoke Step Out, you can press Shift + F11 or type O + Enter in the PowerShell console.
In addition to the shortcut keys that I have described, PowerShell ISE’s debug menu provides stepping options, as well.
How to use stepping
Let’s look at how to step through a simple script. For this guide, I have created a basic “Hello World” script.
$A=”Hello”$B=”World”Write-Host $A $BThe script assigns the word “Hello” to a variable called $A and assigns the word “World" to a variable called $B. The script’s last line uses the Write-Host statement to display the two variables in a way that shows Hello World on the screen.
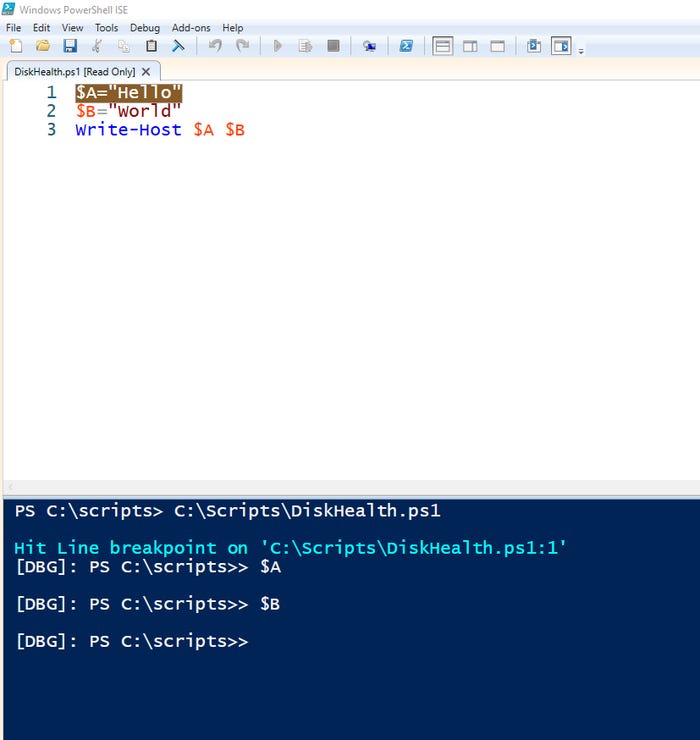
Before stepping through a script, the first thing to do is to save the script. Then, set a breakpoint on the first line of code in the main body of the script. If the script starts with a function, do not set the breakpoint on the function declaration line. Instead, move to the main body’s first line of code and set the breakpoint there. In Figure 3, you can see that a breakpoint has been set on the first line of code.

PowerShell Debug 2-1
Figure 3. The first line of code serves as a breakpoint.
Next, select the “Run / Continue” option from the Debug menu (or press F5). This will execute the first line of code. Because the first line contains a breakpoint, the script will immediately pause at that point.
In Figure 4, you can see that I have entered the commands $A and $B in the console. Both commands return null values because the first line of code has not been executed yet.

PowerShell Debug 2-2
Figure 4. PowerShell has hit the breakpoint at the beginning of the script, and no values have been assigned to the variables yet.
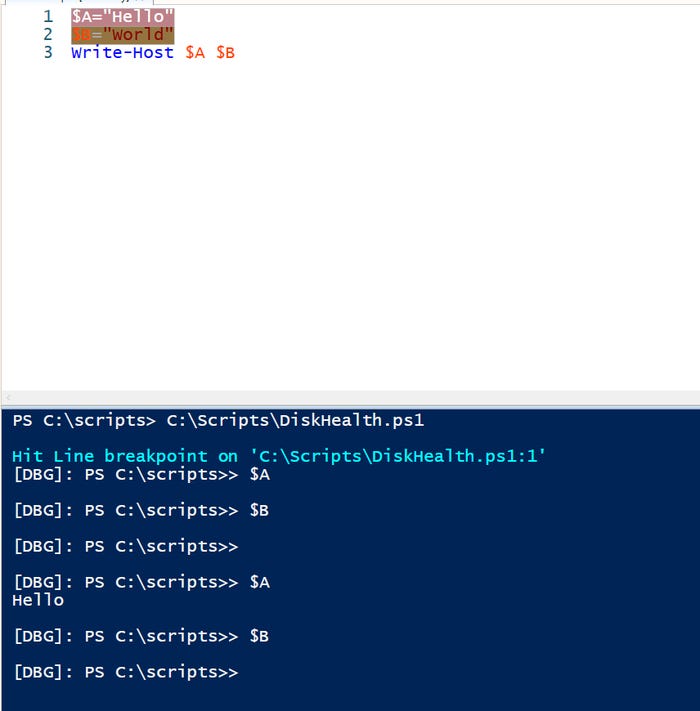
Now let’s go ahead and Step Into the code. Select the Step Into command from the Debug menu. This highlights line 2 of the script as though a breakpoint had been assigned. The console also updates to display an additional prompt line. If you look at Figure 5, you can see that I have entered $A and $B once again. This time, there is a value for $A (Hello), but $B does not have a value yet because it hasn’t been assigned.

PowerShell Debug 2-3
Figure 5. The first line of code has now been executed.
Let’s repeat the process by selecting the Step Into command from the Debug menu again. As before, the breakpoint will move, and the console will update. If I now enter $A and $B, both variables will have values associated with them because the first and second lines of code have been executed.

PowerShell Debug 2-4_0
Figure 6. The second line of code has been executed.
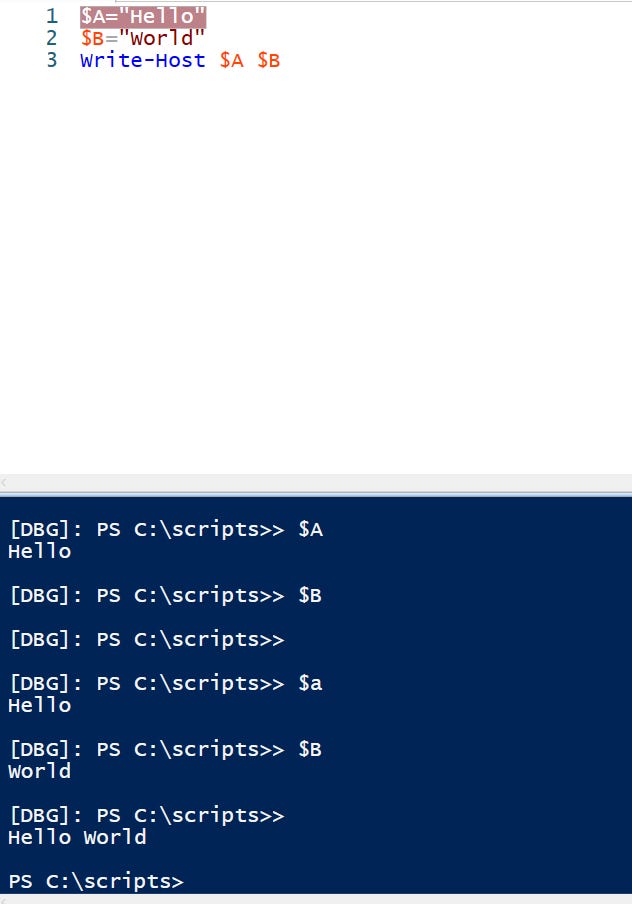
Selecting the Step Into command once more will cause the third line of code to execute. In this case, that means that the script will run to completion, and the words “Hello World” will be displayed in the console. Because the script has finished running, the debugger will automatically close, as shown by the console prompt in Figure 7.

PowerShell Debug 2-5
Figure 7. The script has finished running and the debugger is closed.
Additional PowerShell Resources
About the Author
You May Also Like


.jpg?width=700&auto=webp&quality=80&disable=upscale)
