SharePoint How-To Series: Business Intelligence PrimerSharePoint How-To Series: Business Intelligence Primer
The tools that make up SharePoint Business Intelligence should let us easily interpret the data we are consuming and allow others to make informed decisions based on that data. Of the services available, Excel Services has been around for the longest within SharePoint.
December 7, 2015

It would be an understatement to say that SharePoint has grown substantially as a platform in the last few iterations. One of the most important additions to the platform is native business intelligence. No longer do you need to set up lots of core infrastructure or buy third-party components; you can now just create what you need in SharePoint and start using it. Here's how to get started with SharePoint's BI capabilities.
One of the challenges as you begin this process is knowing what is available for your on-premises environments and what Office 365 brings to the table for your cloud solution. I wrote a short post a while back that talks about what Office 365 Power BI offers. In this post, however, we will focus on the on-premises story. So, let's take a look at what out-of-the-box SharePoint 2013 offers or supports:
Excel Services
PerformancePoint
Reporting Services
Power View
Business Connectivity Services
These core components offer either a way to consume data, interrogate or just present data visually. Business Intelligence is not just about presenting nice little charts or dashboards, though.
Wikipedia provides this definition for for “business intelligence.”
“Business intelligence (BI) is often described as the set of techniques and tools for the transformation of raw data into meaningful and useful information for business analysis purposes. The term data surfacing is also more often associated with BI functionality. BI technologies are capable of handling large amounts of unstructured data to help identify, develop and otherwise create new strategic business opportunities. The goal of BI is to allow for the easy interpretation of these large volumes of data.”
If this is the case, then the tools that make up SharePoint Business Intelligence should let us easily interpret the data we are consuming and allow others to make informed decisions based on that data. So, let’s take a look at the services available and see what they can do for us.
Excel Services has been around for the longest within SharePoint.
Excel Services offers four core interfaces:
Web Access Web Part, which enables you to view and interact with a live workbook by using a browser
Excel Web Services, for programmatic access
An ECMAScript (JavaScript, JScript) object model, for automating and customizing
A representational state transfer (REST) API, for accessing workbook parts directly through a URL
These interfaces make up the core system that can be used. Behind the scenes, Excel Services is far more complex. Excel Service components are split between the application and Web server roles within SharePoint.

NOTE: In SharePoint 2016, these services have been removed and added to the new Office Online Server.
Understanding where the core components reside is important as you enable the features you need. Now, if we access SharePoint Central Administration, we can see within the Service Applications that we have administration pages allowing us to configure some basic settings.

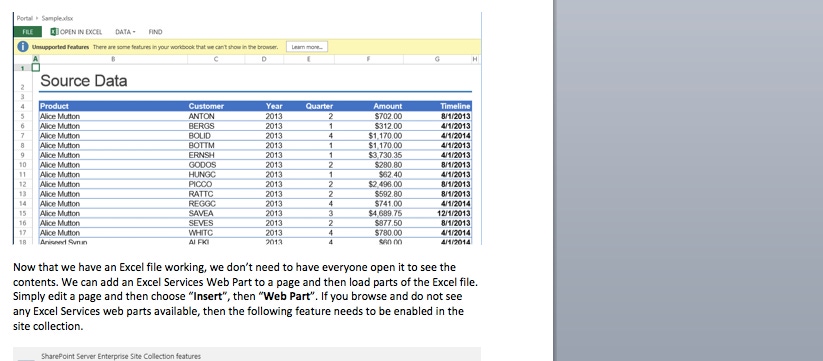
These settings will allow for various elements to function or not. One of Excel Services' features is the ability to render Excel files directly within the browser. Within a document library, we can enable the in-browser experience by choosing the following the option.
This option is actually enabled by default, so any Excel files that load should just do so in the browser. Now, of course, if you have Office Web Apps installed, this would change slightly.

Now that we have an Excel file working, we don’t need to have everyone open it to see the contents. We can add an Excel Services Web Part to a page and then load parts of the Excel file. Simply edit a page and then choose “Insert,” then “Web Part." If you browse and do not see any Excel Services Web parts available, then the following feature needs to be enabled in the site collection.

Once this feature is enabled, you should see the “Business Data” category, which offers a whole host of Web parts.

For this example, we will simply add the “Excel Web Access” web part. Once added we need to wire it together to the spreadsheet we used before.

Click the link to open the tool pane.

The tool pane should then open, displaying two picker options at the top.

Let’s first select the Workbook we are going to use.

Once selected, “Apply” this setting and then web part should now display the data from the spreadsheet, and then in the tool pane the various options should be made available.


Selecting these options will change the display to what is desired. After deselecting a few options, the Web Part will look something like this.

Depending on what you set, the Web Part may look a little different. For example, if you created named ranges, you could specify that the second picker option would render only those values.


As you can see, using simple Excel capabilities we can add dashboard-type functionality to SharePoint--creating charts and tables of data within Excel and then surfacing them within the Web Parts of SharePoint.
In the next post, we will go deeper into Excel Services, as well as into other features of the business intelligence stack for SharePoint.
To register for Liam Cleary's Dec. 17 SharePoint for Beginners webinar, click here.
About the Author
You May Also Like


.jpg?width=700&auto=webp&quality=80&disable=upscale)
