Solving Performance Problems with the Query StoreSolving Performance Problems with the Query Store
Many times, something changes on the server or something in the database is changed or sometimes the application code itself gets changed and performance begins to degrade. Troubleshooting typically happens well after the fact and often only when the application’s performance becomes a problem.
May 20, 2016

Troubleshooting performance problems is always one of the database professional’s toughest jobs. Many times, something changes on the server or something in the database is changed or sometimes the application code itself gets changed and performance begins to degrade. Troubleshooting typically happens well after the fact and often only when the application’s performance becomes a problem. Other kinds of performance issues can be things like unpredictable and intermittent slowdowns where you might be having trouble keeping application performance within the expected boundaries. It’s also possible to experience a performance problem after you’ve upgraded SQL Server itself and the relational database engine creates new query plans that aren’t as good as the previous plans. Finding the source of these kinds of performance problems can be difficult. SQL Server provides dynamic management views that can allow you to view the query plans that are in the active plan cache. However, there’s no way to predict how long a given plan will stay in the plan cache and older versions are typically gone from the cache when you go to investigate a performance issue. You can’t see prior versions of the plans and it’s impossible to identify what was changed. That’s where SQL Server 2016’s new Query Store comes to the rescue.
Query Store: The SQL Server Flight Recorder
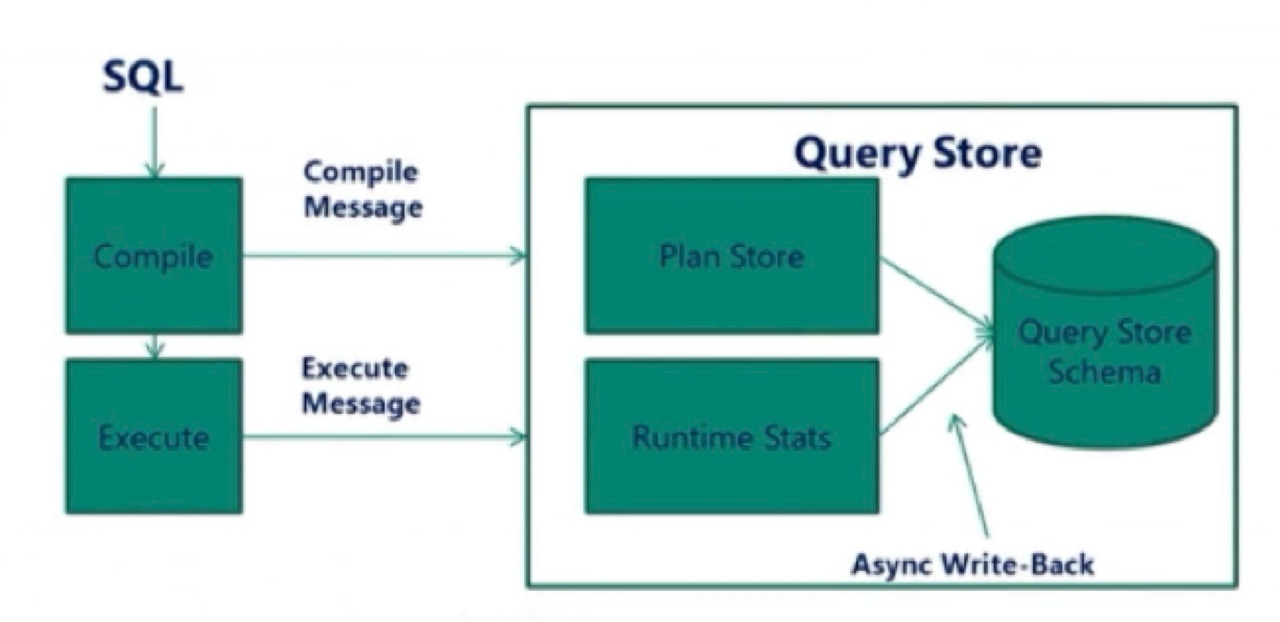
SQL Server 2016’s new Query Store feature makes it possible to troubleshoot these types of performance problems. The Query Store enables you to see differences in query plan changes over time. The SQL Server 2016 Query Store feature is able to save historical execution plans as well as the query statistics that go with those plans. SQL Server 2016’s Query Store can be enabled on an individual database basis and it automatically captures a history of queries, plans, and runtime statistics. The Query Store separates data by time windows enabling you to see changes in the query plans over time as well as tracking usage patterns. The Query Store allows you to see how many times a query has been run, identify the top queries, monitor the changes in a query plan over time and see the resources required for the plan. You can see an overview of how the Query Store works the accompanying illustration.

Figure 1 – An Overview of the Query Store
In Figure 1, you can see the SQL Server stores all of the text associated with a query as well as the statistics that were generated at runtime. When a query gets executed on a database that has the Query Store enabled, the compiled query Execution Plan is written to the Query Store Plan Store. In addition, the runtime information from the queries’ execution is written to the Runtime Stats Store. This data is initially stored in-memory then it is asynchronously written to disk. The Query Store records its information in the primary file group of the database where it is enabled. You can control the amount of data and the duration that SQL Server will store the Query Store information.
Using the Query Store is a great new tool for database professionals to troubleshoot performance problems. It doesn’t require changes to existing applications and it provides you with new tuning information you never had before.
Underwritten by HPE and Microsoft
About the Author
You May Also Like


.jpg?width=700&auto=webp&quality=80&disable=upscale)
