
Balancing growth and performance optimization is an ongoing challenge across all aspects of business for today's enterprises. This is particularly true in modern DevOps environments, where there is constant pressure to release more features at a faster pace while also ensuring the stability and efficiency of existing systems.
Yet most DevOps teams are facing budget limitations and resource cuts that force IT leaders to face difficult trade-offs between the needs of the business, their customers, and even their own teams. So, how can you ensure that you strike the right balance and meet the needs of both new and existing users and the business?
Just a Part of the Job
There is an inherent tension between building new features and optimizing the performance of existing features. It has been present since the era of waterfall development, has persisted through the adoption of agile methodologies, and is now a key component in the practice of DevOps. This tension arises from a finite set of resources — from available time and budget to skilled personnel — and the need to prioritize between competing goals.
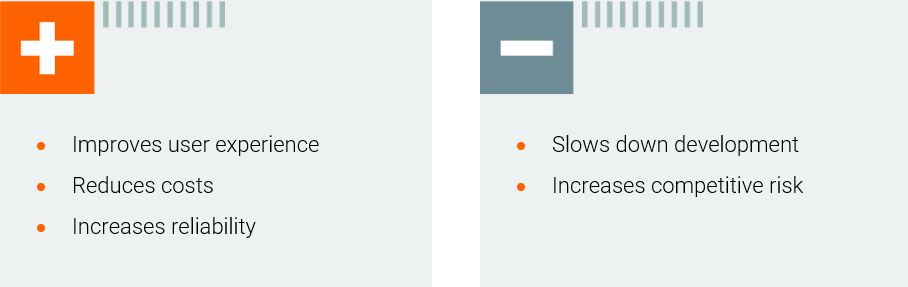
Building new features:
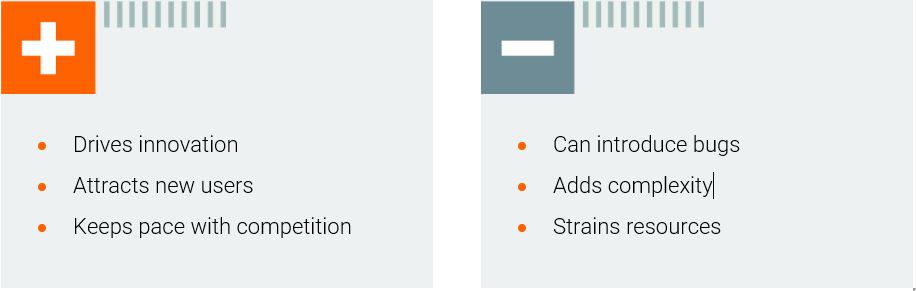
Optimizing performance:
Not managing these competing priorities between two equally crucial areas for the business can lead to several challenges for IT and DevOps teams.
Some prominent examples include scope creep, which makes existing features more complex and harder to maintain, adds difficulties and expenses due to delayed performance optimization, and impacts to the business's bottom line due to missing features or inconsistent performance stability.
Metrics can play a crucial role in managing these tensions. They provide data-driven insights to inform decisions as they help measure the impact and ROI of new features by tracking user engagement and feature adoption as well as measuring performance quality — via indicators such as response time, page load time, and error rates — to highlight areas for improvement. Additionally, code analysis tools and code coverage metrics can help leadership understand the potential future costs of neglecting performance and compare the expected benefits of new features with anticipated costs.
Identifying, measuring, and communicating meaningful, data-driven metrics can serve as a north star to help each member of a DevOps team prioritize more efficiently and achieve both business and technical objectives. However, to ensure the right balance is struck between the needs of various teams and departments, it's essential to select holistic metrics that span both performance and development objectives.
Performance Metrics
Key performance metrics that gauge the health, performance, and resilience of a software-as-a-service (SaaS) system can be used to optimize the performance of preproduction and production systems across four main areas: availability and uptime; performance and speed; error rates and stability; and resource utilization.
Availability and uptime:
Uptime: A measure of the percentage of time (ideally 99%+) the system is accessible to users. A dip in uptime can indicate system instability or outages that impact user experience and can lead to churn.
Mean Time to Repair (MTTR): The average time it takes to resolve an outage or incident. A lower MTTR indicates a faster response and recovery time, minimizing downtime and its impact on users.
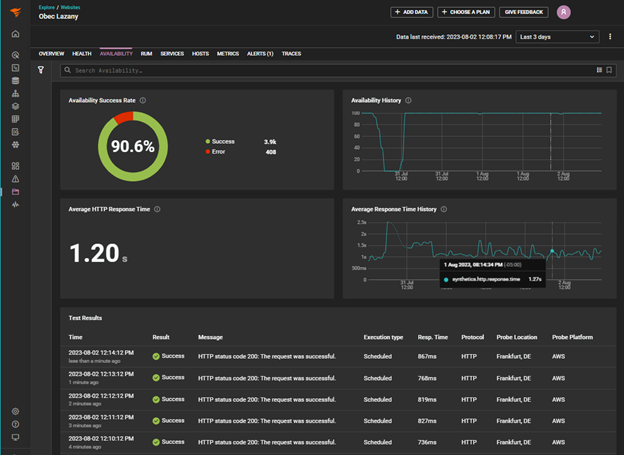
Availability and response time metrics displayed in SolarWinds Observability
Performance and speed:
Response time: How long it takes for the system to respond to user requests. Faster response times improve user experience and increase user satisfaction.
Page load time: How long it takes for a webpage to load fully, which impacts user experience and engagement.
Throughput: The number of requests the system can handle per unit of time, which indicates if the system can handle peak loads without performance degradation.
Resource utilization:
CPU utilization: The percentage of available CPU resources being used by the system. High utilization can lead to bottlenecks and slowdowns.
Memory utilization: The percentage of available memory resources being used by the system, which can similarly impact performance.
Network utilization: The percentage of available network bandwidth being used by the system.
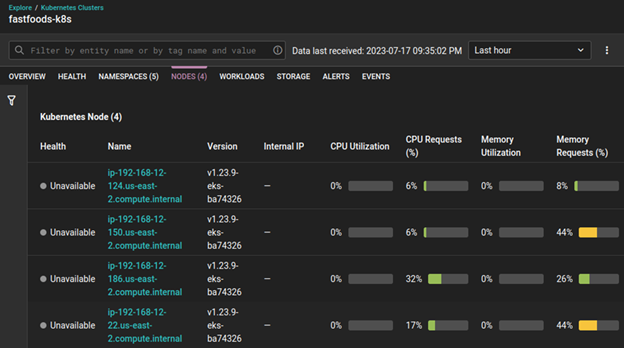
CPU and memory utilization metrics displayed in SolarWinds Observability
Error rates and stability:
Error rate: The percentage of user requests resulting in errors, indicating the stability and reliability of the system.
Application crashes: The number of unexpected application crashes or terminations, which can disrupt users and indicate underlying system instability.
Development and Release Metrics
Since the 1970s, performance metrics such as uptime, error rates, and response time have been used to measure system performance. However, the rise of Agile and DevOps led to the increased usage of release metrics. Initially, the adoption of Agile and the emphasis on continuous improvement created a need to measure common release metrics like deployment frequency to track progress. Later, DevOps expanded the definition of release to include the entire software delivery pipeline and increased the focus on performance across the DevOps team.
In 2014, a research initiative at Google Cloud Platform, the DevOps Research and Assessment (DORA), performed the first of its annual studies on the practices of software delivery teams. The goal of the DORA survey and report is to understand the capabilities that drive software delivery and operations performance. The DORA report is widely utilized by industry analysts and thought leaders as a standard for measuring software delivery performance and is a valuable resource for anyone interested in learning more about improving their DevOps practices.
Specifically, the DORA metrics measure:
Deployment frequency: How often does the team deploy new code to production?
Lead time for changes: How long does it take for a change to go from being committed to code to being deployed to production?
Change failure rate: How often does a deployment cause a production failure?
Mean time to restore (MTTR): How long does it take to recover from a production failure?
Performance and Release Metrics Together
Release delivery metrics and performance metrics work together to paint a holistic picture of the health and effectiveness of an enterprise's custom applications for a better perspective when balancing competing priorities.
Release delivery metrics track the predictability, efficiency, and quality of the release cycle.
Performance metrics, meanwhile, measure the application's ability to meet user expectations and business objectives, such as response time, uptime, and user feedback.
At a high level, release metrics measure the efficiency and quality of the delivery pipeline, while performance metrics identify areas for improvement. They can help measure the impact of new features, monitor KPIs, measure technical debt, and use cost benefit analysis. Both sets of metrics come together to provide a complete picture of application health and offer deep insight into an application's strengths and weaknesses. Using this combined insight, you can make informed decisions to optimize your development process, enhance application performance, and ultimately deliver greater value to your users and business. The right metrics can serve as a north star and align prioritization decisions to achieve both business and technical objectives.
About the author:
Krishna Sai is Senior Vice President, Engineering, at SolarWinds.


